InfluxDB#
To simplify the integration with InfluxDB, webhooks can be formatted to align with Influx’s data API requirements.
Prerequisites#
- A user with access to the Coiote IoT Device Management platform and appropriate permissions
- A LwM2M device
- An InfluxDB account (you can create a free InfluxDB Cloud account)
Setup InfluxDB#
-
Open your InfluxDB account.
-
Create a new Bucket for storing the time series data by going to: ↑ > Buckets.

-
Name the Bucket.

-
Copy the Bucket ID and save it to use later.

Create API Token#
Go to the API Tokens tab.

Create a new API token
Create a custom API Token
Preferably, create a custom API Token which has only access to the specific Bucket you just created. Make sure to select Read and Write rights.

Copy the API Token and save it for later.
Create webhook in Coiote IoT DM#
-
In your Coiote IoT DM, select: Integrations > Data Integration Center.

-
Click Add event handler and select Webhook.

-
Provide Basic information such as the name and description. Also, you can activate the event handler after creation.

-
Select the events which will trigger the HTTP(S) requests.

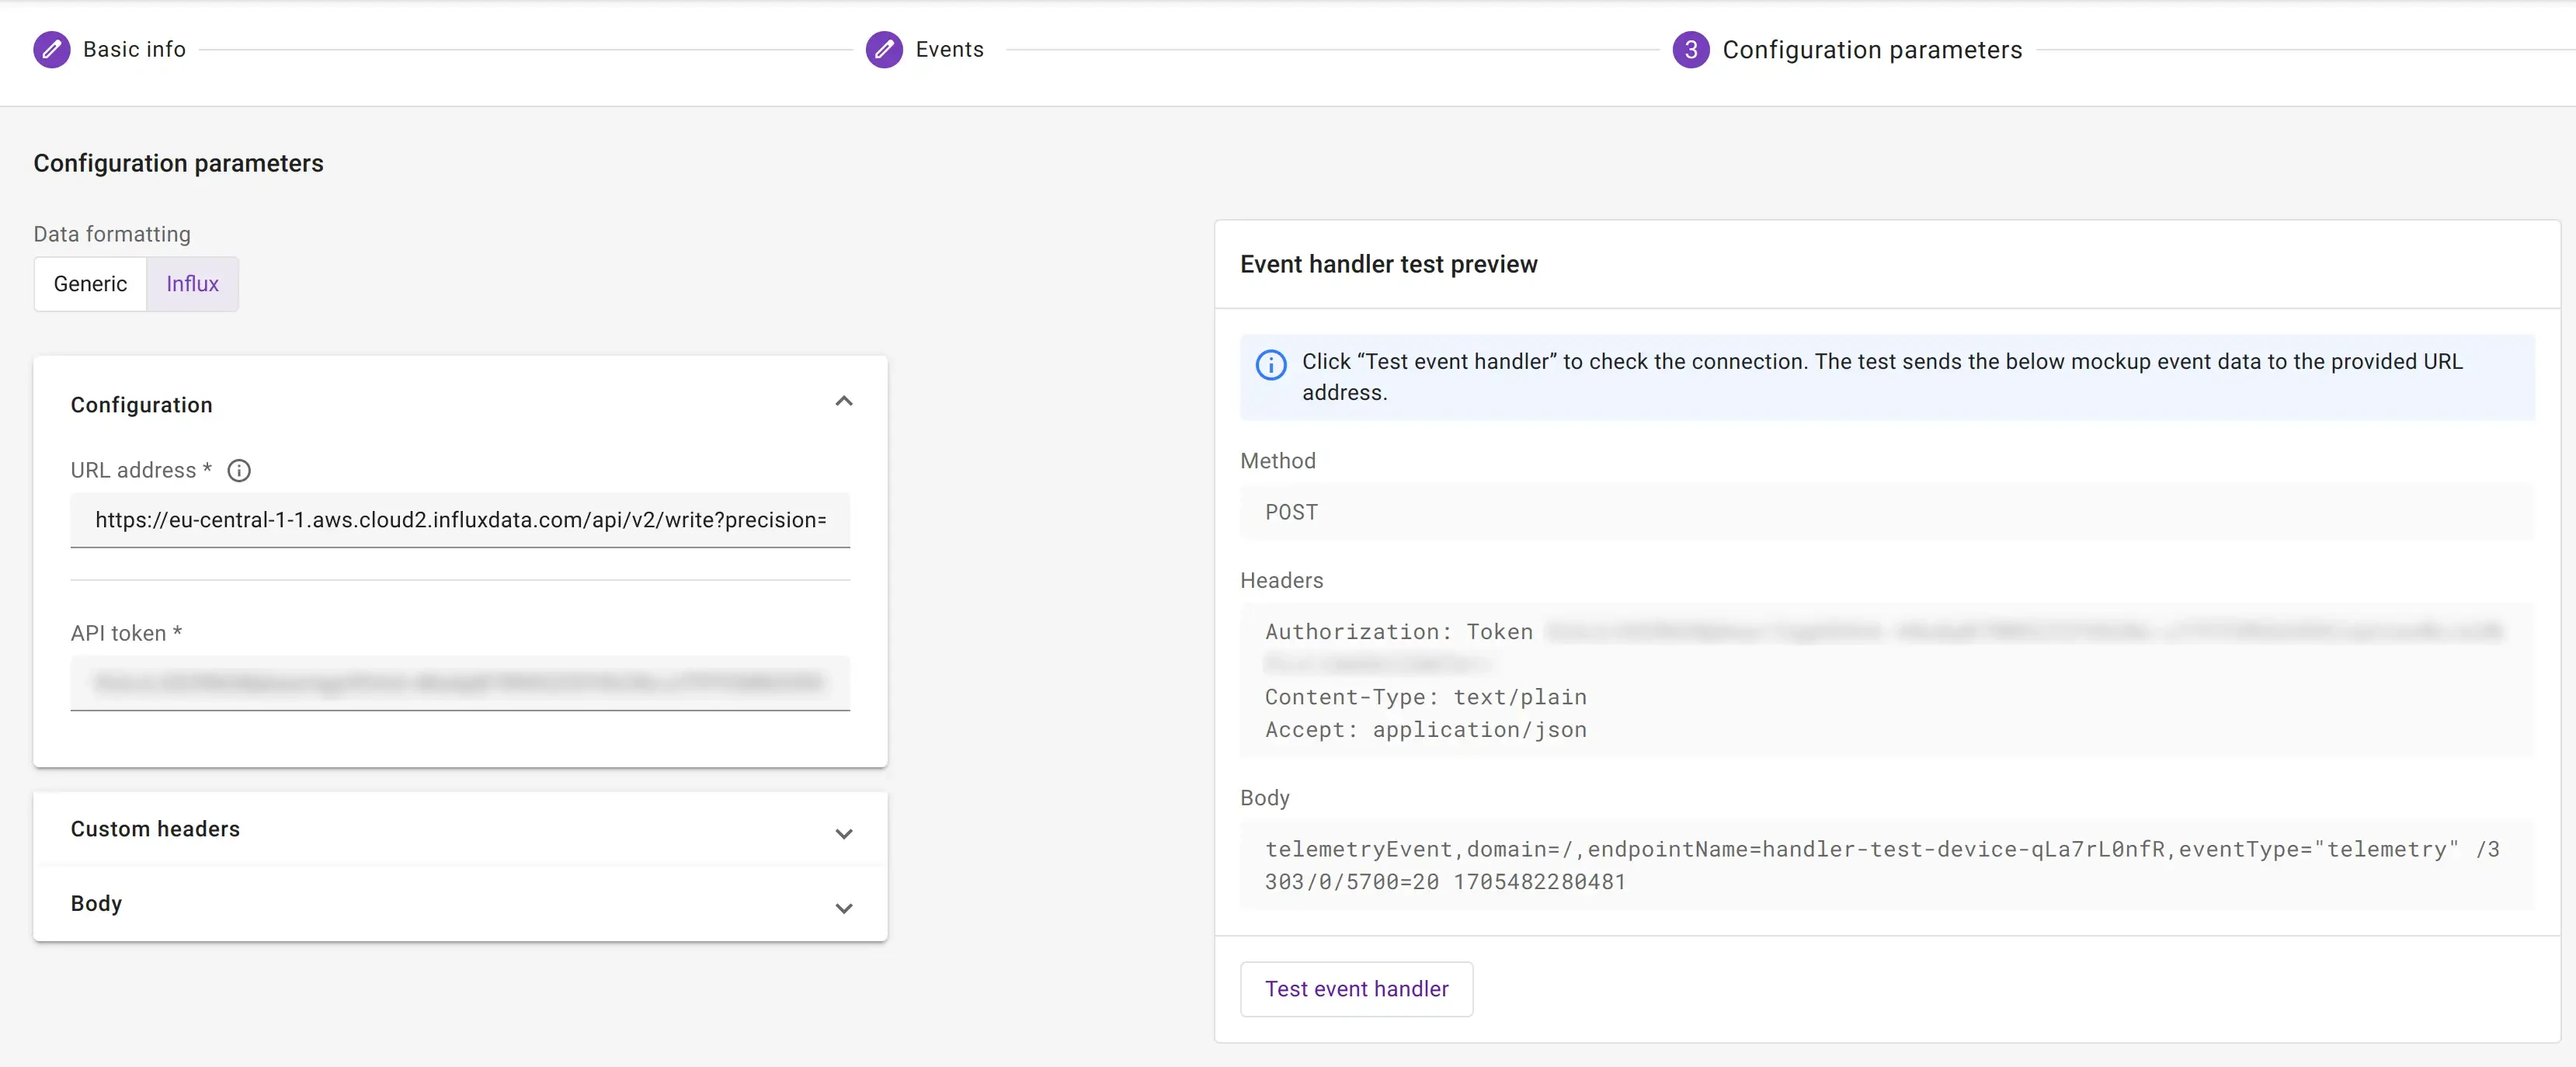
Configure parameters#
-
Select the Influx data formatting option.

-
Set the URL address. The URL address is composed of the following parts:
- The Influx URL e.g.:
https://eu-central-1-1.aws.cloud2.influxdata.com. You can find the URL in the address bar of your browser when using InfluxDB Cloud. - The InfluxDB API:
/api/v2/write - The precision parameter indicating our data is ingested with millisecond precision:
?precision=ms - The Bucket ID, starting with
&bucket=
When combined, the URL address looks as follows:
https://eu-central-1-1.aws.cloud2.influxdata.com/api/v2/write?precision=ms&bucket=bc123456789ABCDEInfo
For more information about the Influx API, visit Influx's API documentation.
- The Influx URL e.g.:
-
Add the API token which you previously created in your InfluxDB account.
-
To create the event handler, click Next step and Add event handler.
Tip
You can use the Test event handler option to validate the configuration of the HTTP request before creating the event handler. When performing such test, an event should arrive in your Influx bucket.

Configure body template#
Influx uses custom protocol named line protocol. It consists of four components: measurement name, tags, fields and timestamp. You can adjust each one according to your needs by editing the body template.
<measurement>[,<tag_key>=<tag_value>] <field_key>=<field_value> [<timestamp>]
You should first define the body template
When influx creates a measurement table, columns types are defined and all requests that don't match the type are rejected. It implies that any further changes are impossible and you will need to setup a proper body template before sending data.
Telemetry with string type resources
For influx to work with string value resources, you should add extra quotes around $value. This will cause all
value resources to be of string type. Therefore to create e.g. diagrams, you need casting.
telemetryEvent,domain=$domainId,endpointName=$endpointName,eventType="telemetry" $url="$value" $timestamp
Monitor events in InfluxDB#
-
After activating the event handler, in your InfluxDB account, open your Bucket.
-
Add the following query:
SELECT * FROM "telemetryEvent" WHERE time >= now() - interval '1 hour'SELECT * FROM "deviceEvent" WHERE time >= now() - interval '1 hour' -
To run the script, press: RUN.
If the integration is set up correctly, the device events are visible in the table.
