Visualize device data#
The Dashboard consists of widgets which display telemetry data. Data can be collected in one of the following ways:
- An observation is set on a resource
- A read command is invoked on a resouce
- The device sends a LwM2M SEND message with a resource value
Set observation#
To start collecting data to be displayed on your Dashboard, start observing one or multiple resources.
Note
By default, the data is stored for 30 days. The storage retention period can be changed in the Domain configuration view.
Important
Any monitored string resource values that exceed the 100-character limit will be automatically trimmed to fit within the limit.
- Go to the Device Center of a connected device and click the Data model tab.
- In the list of objects, expand an object (e.g. Temperature
/3303/) and click the eye icon in the Operations column.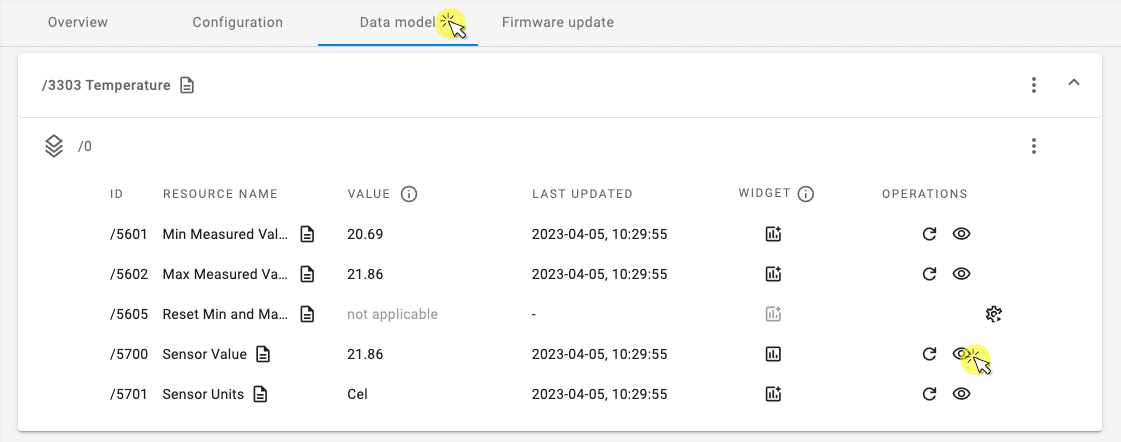
-
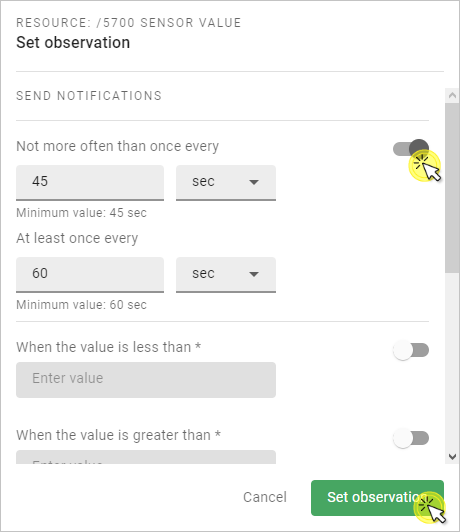
In the side navigation menu, enable the Not more often than once every and At least once every attributes and click Save.
Info
- Not more often than once every - the minimum time in seconds between two notifications.
- At least once every - the maximum time in seconds between two notifications. The notification is sent even if the value hasn't changed.
Create Widget#
-
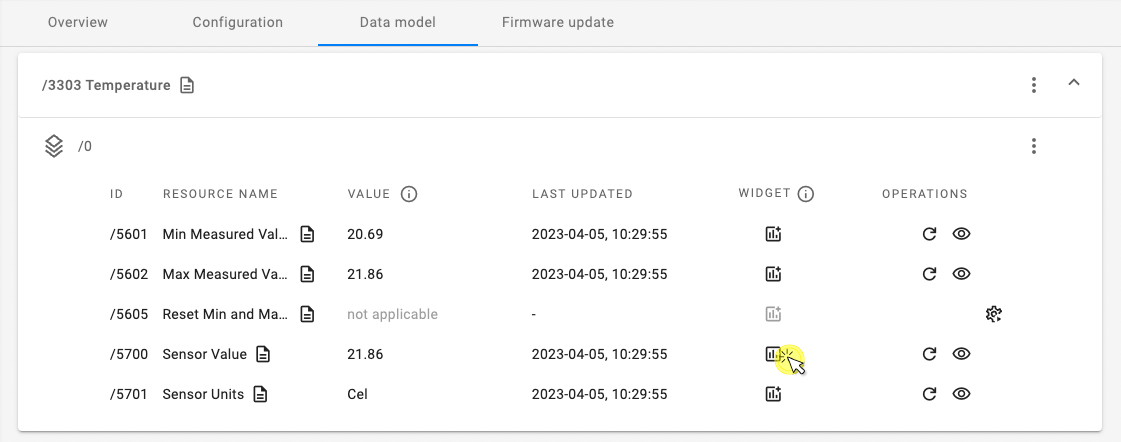
In the expanded object card, click the Add widget icon in the Widget column.
Important
The action of adding a widget applies to all the devices in your domain, but the widget will only display data from the 10 oldest devices (based on their Creation time).
View widget in your Dashboard#
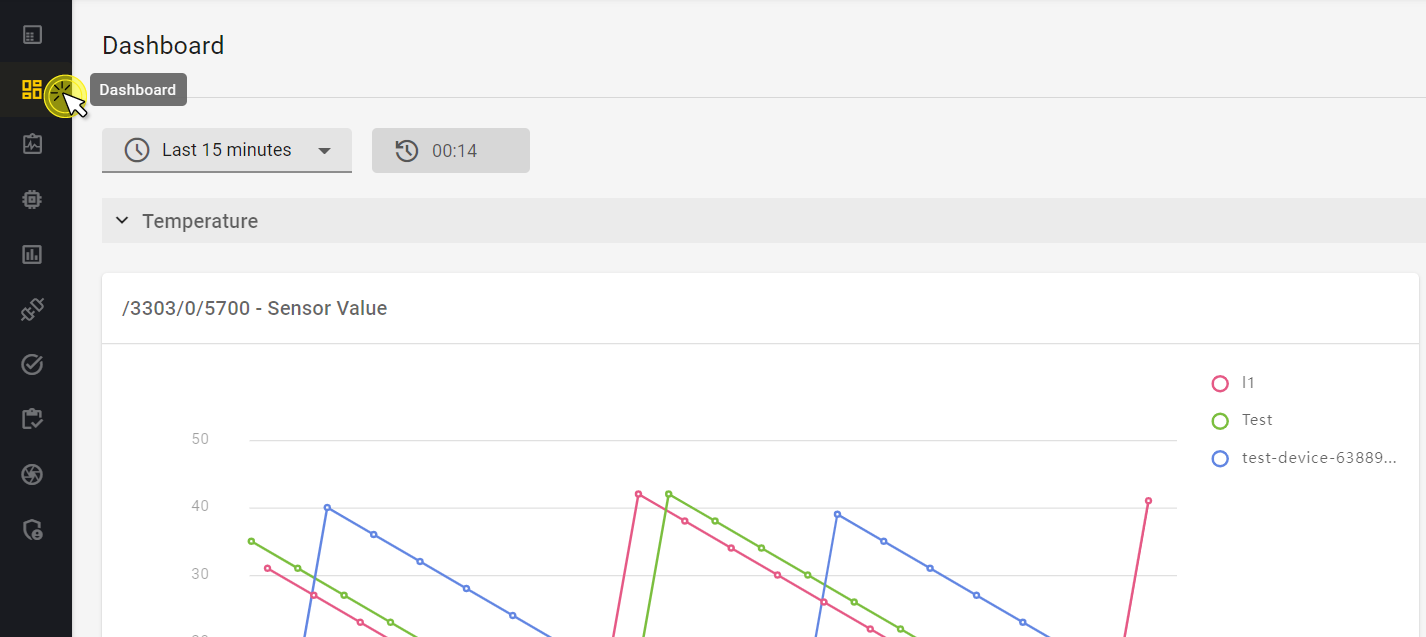
To see the device data visualized on the widget, enter your Dashboard.
- From the left-side menu, select Dashboard.
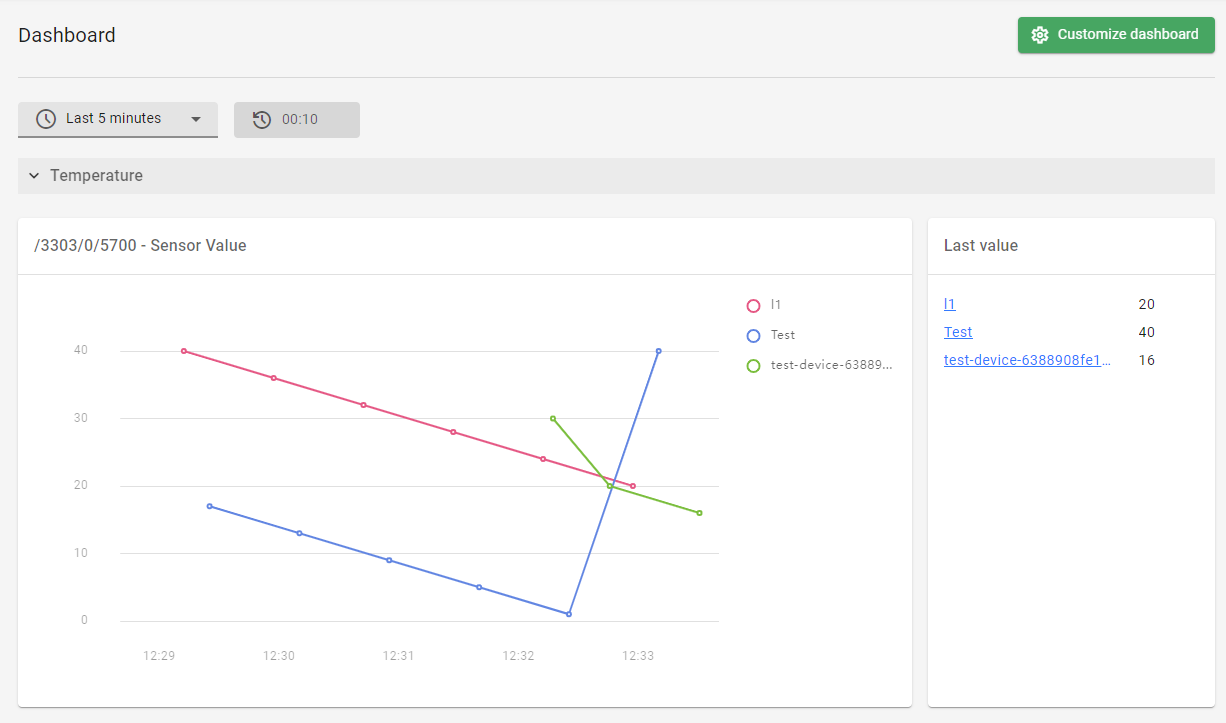
- Expand the widget you just created, you should see a view similar to this:
-
Adjust the timespan for the collected data by selecting the desired period in the timespan expandable list.
Note
The data is refreshed automatically and periodically every 15 seconds, there's no need to refresh the page manually.
Tip
If the widget chart displays no data, the cause might be that the 10 oldest devices in your domain were not active within the chosen timespan and no data was reported. Try choosing a wider timespan or check device connection status.
Customize dashboard#
Dashboards can be customized. Click Customize dashboard to switch to edit mode.
- To change the widget name, expand a widget and click the pencil icon. Type the new name and click Save.
- To delete a widget, expand a widget and click the trash bin icon.
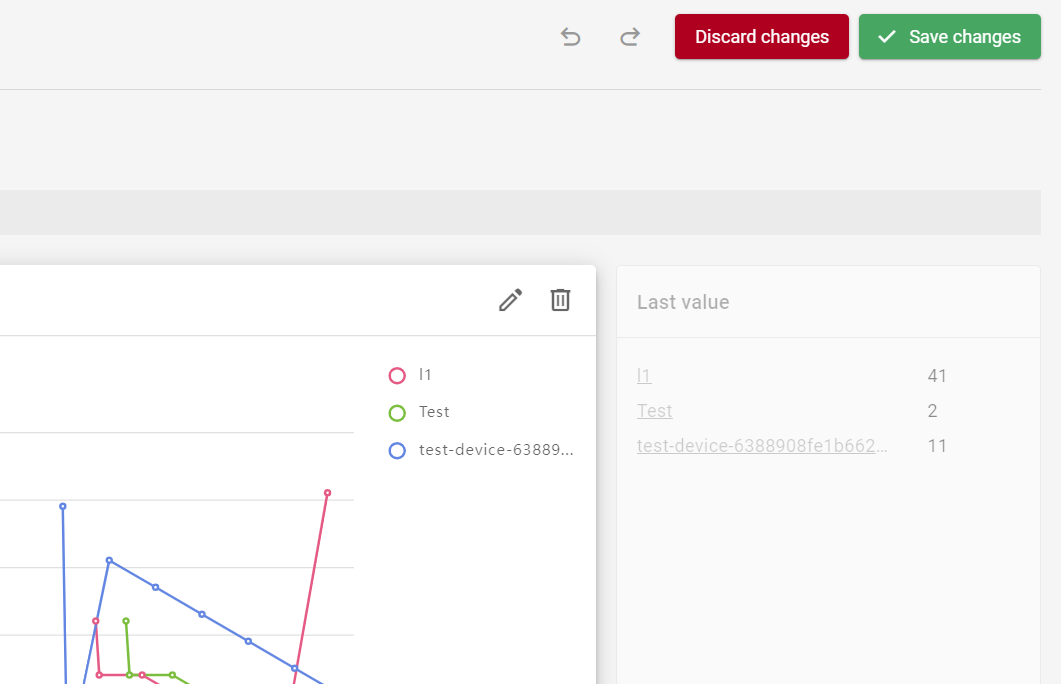
- To undo or redo your edits, click the undo or redo arrows.
- To exit edition mode without saving changes, click Discard changes and Discard in the dialog window.
- To exit edition mode and save changes, click Save changes.